February 2026 delivered a reality check across much of the Canadian housing market. Sales activity remained below historical averages in most major centres, year-over-year prices continued their decline in Ontario and British Columbia, and the ongoing U.S.-Canada tariff standoff injected fresh uncertainty into an already cautious market. Yet underneath the headline weakness, regional divergence is widening — and for professionals who know where to look, February's data tells a more nuanced story than the bearish headlines suggest.
The National Picture: A Market in Transition
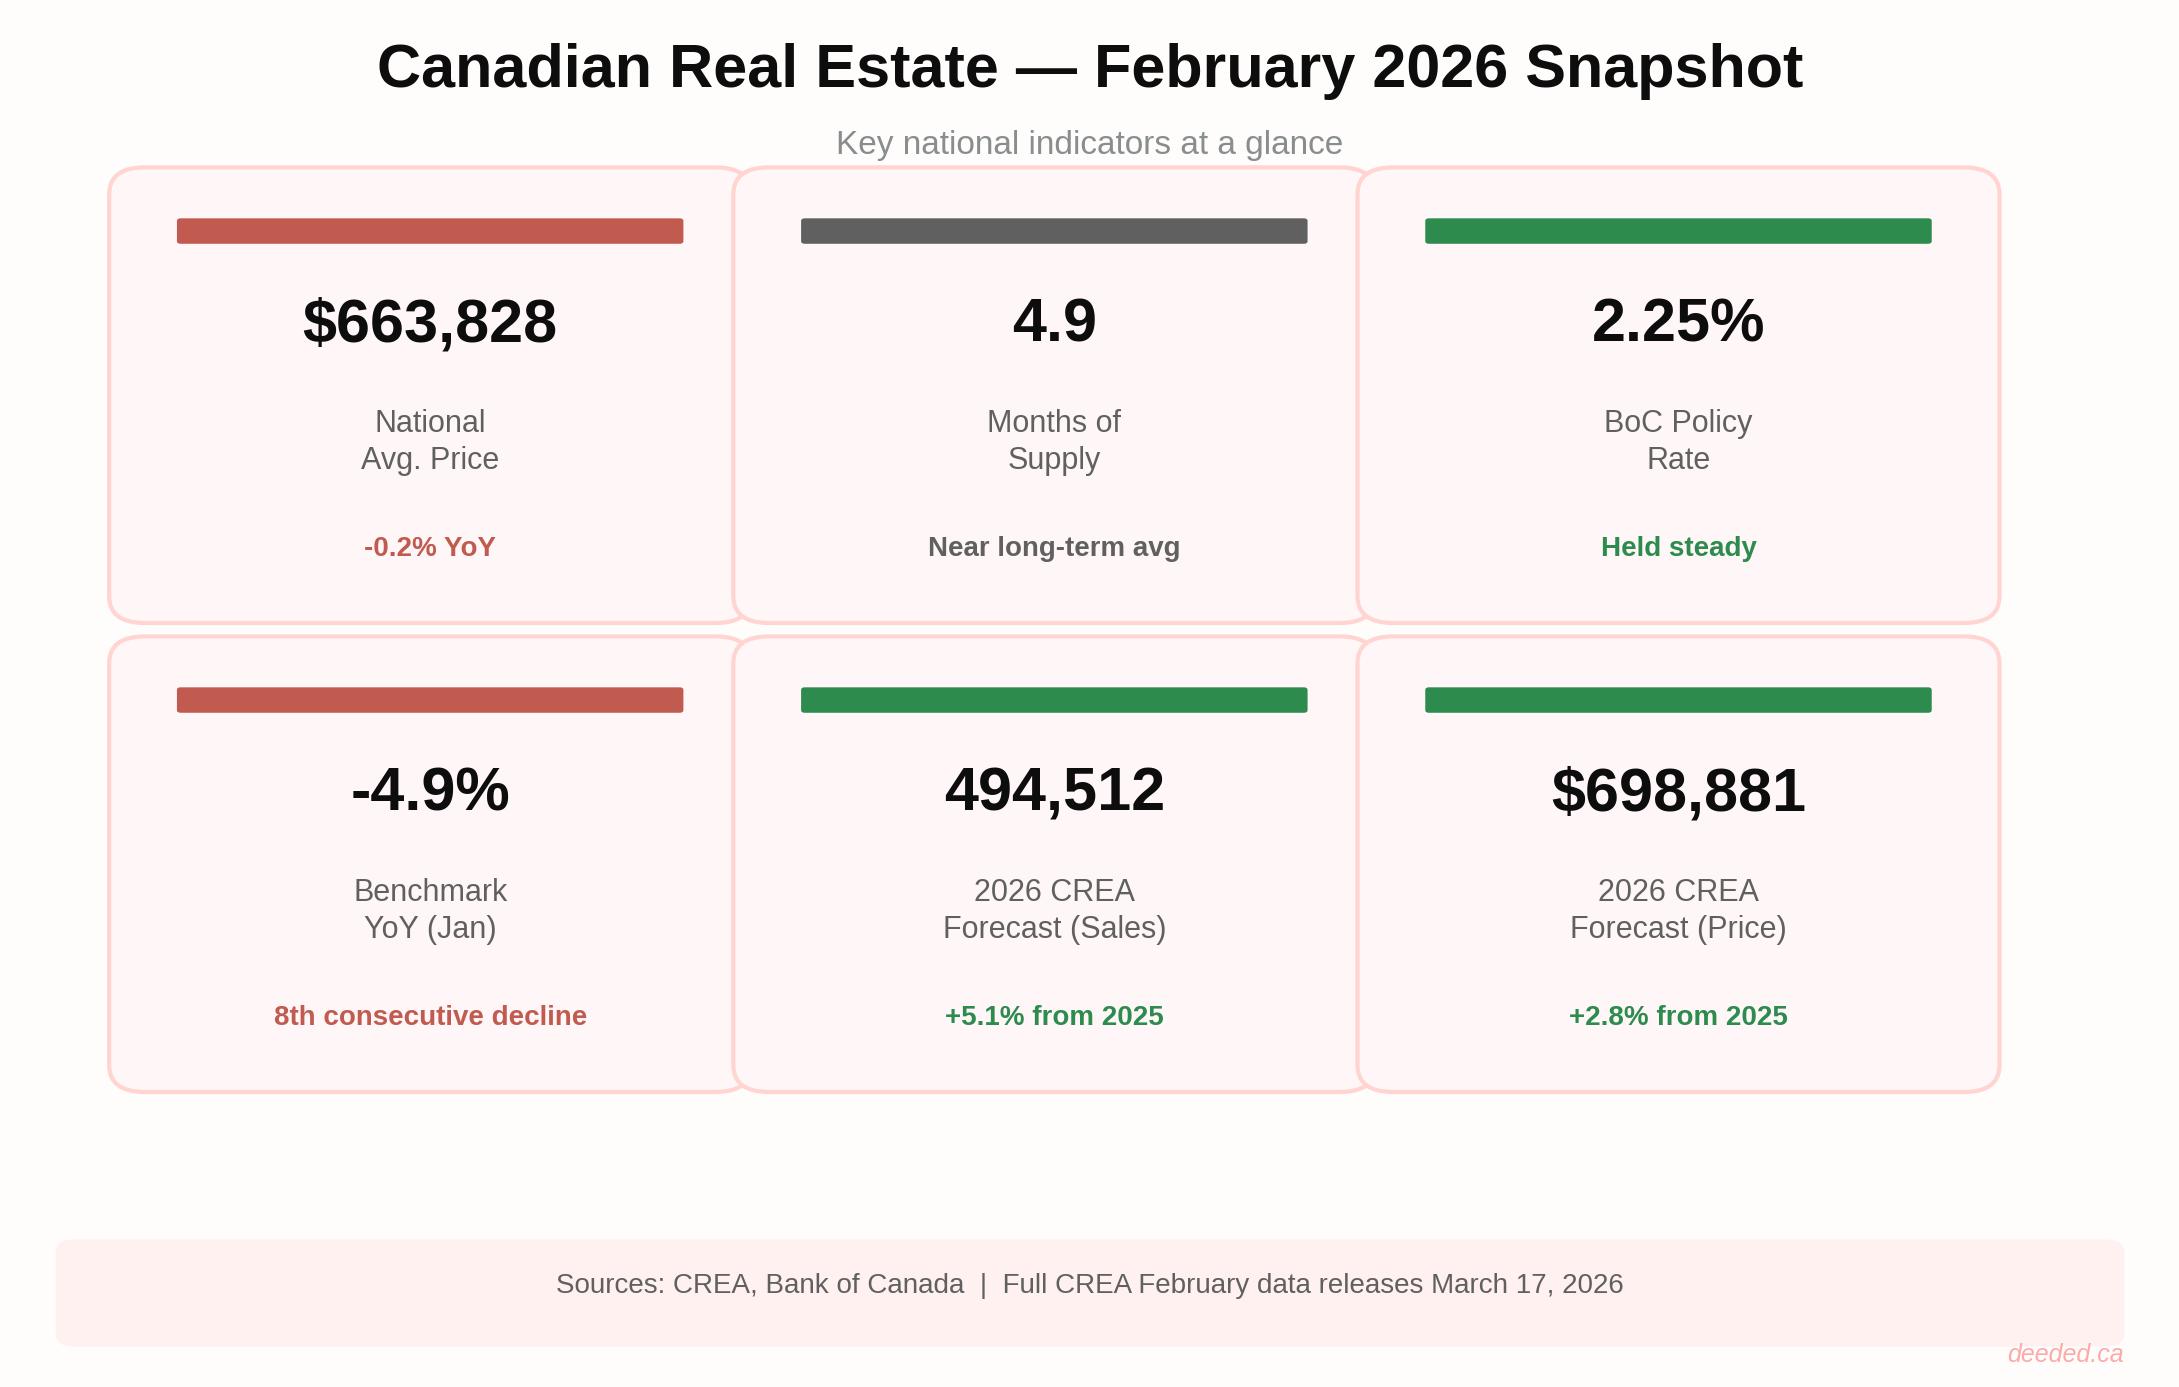
The national average home price came in at approximately $663,828 in February 2026, down a modest 0.2% year-over-year — essentially flat on a national basis. But that top-line number masks significant regional variation.
The MLS® Home Price Index (HPI) continued its slide, sitting 4.9% below year-ago levels as of the most recent January 2026 CREA data, with the February national release expected March 17, 2026. Months of inventory stood at 4.9 nationally at the end of January, up from 4.6 in December and hovering right around the long-term average of five months.
New supply jumped 7.3% month-over-month in January, led by Montreal, Quebec City, Calgary, Greater Vancouver, and Victoria — a sign that sellers are testing the market even as buyers remain cautious.
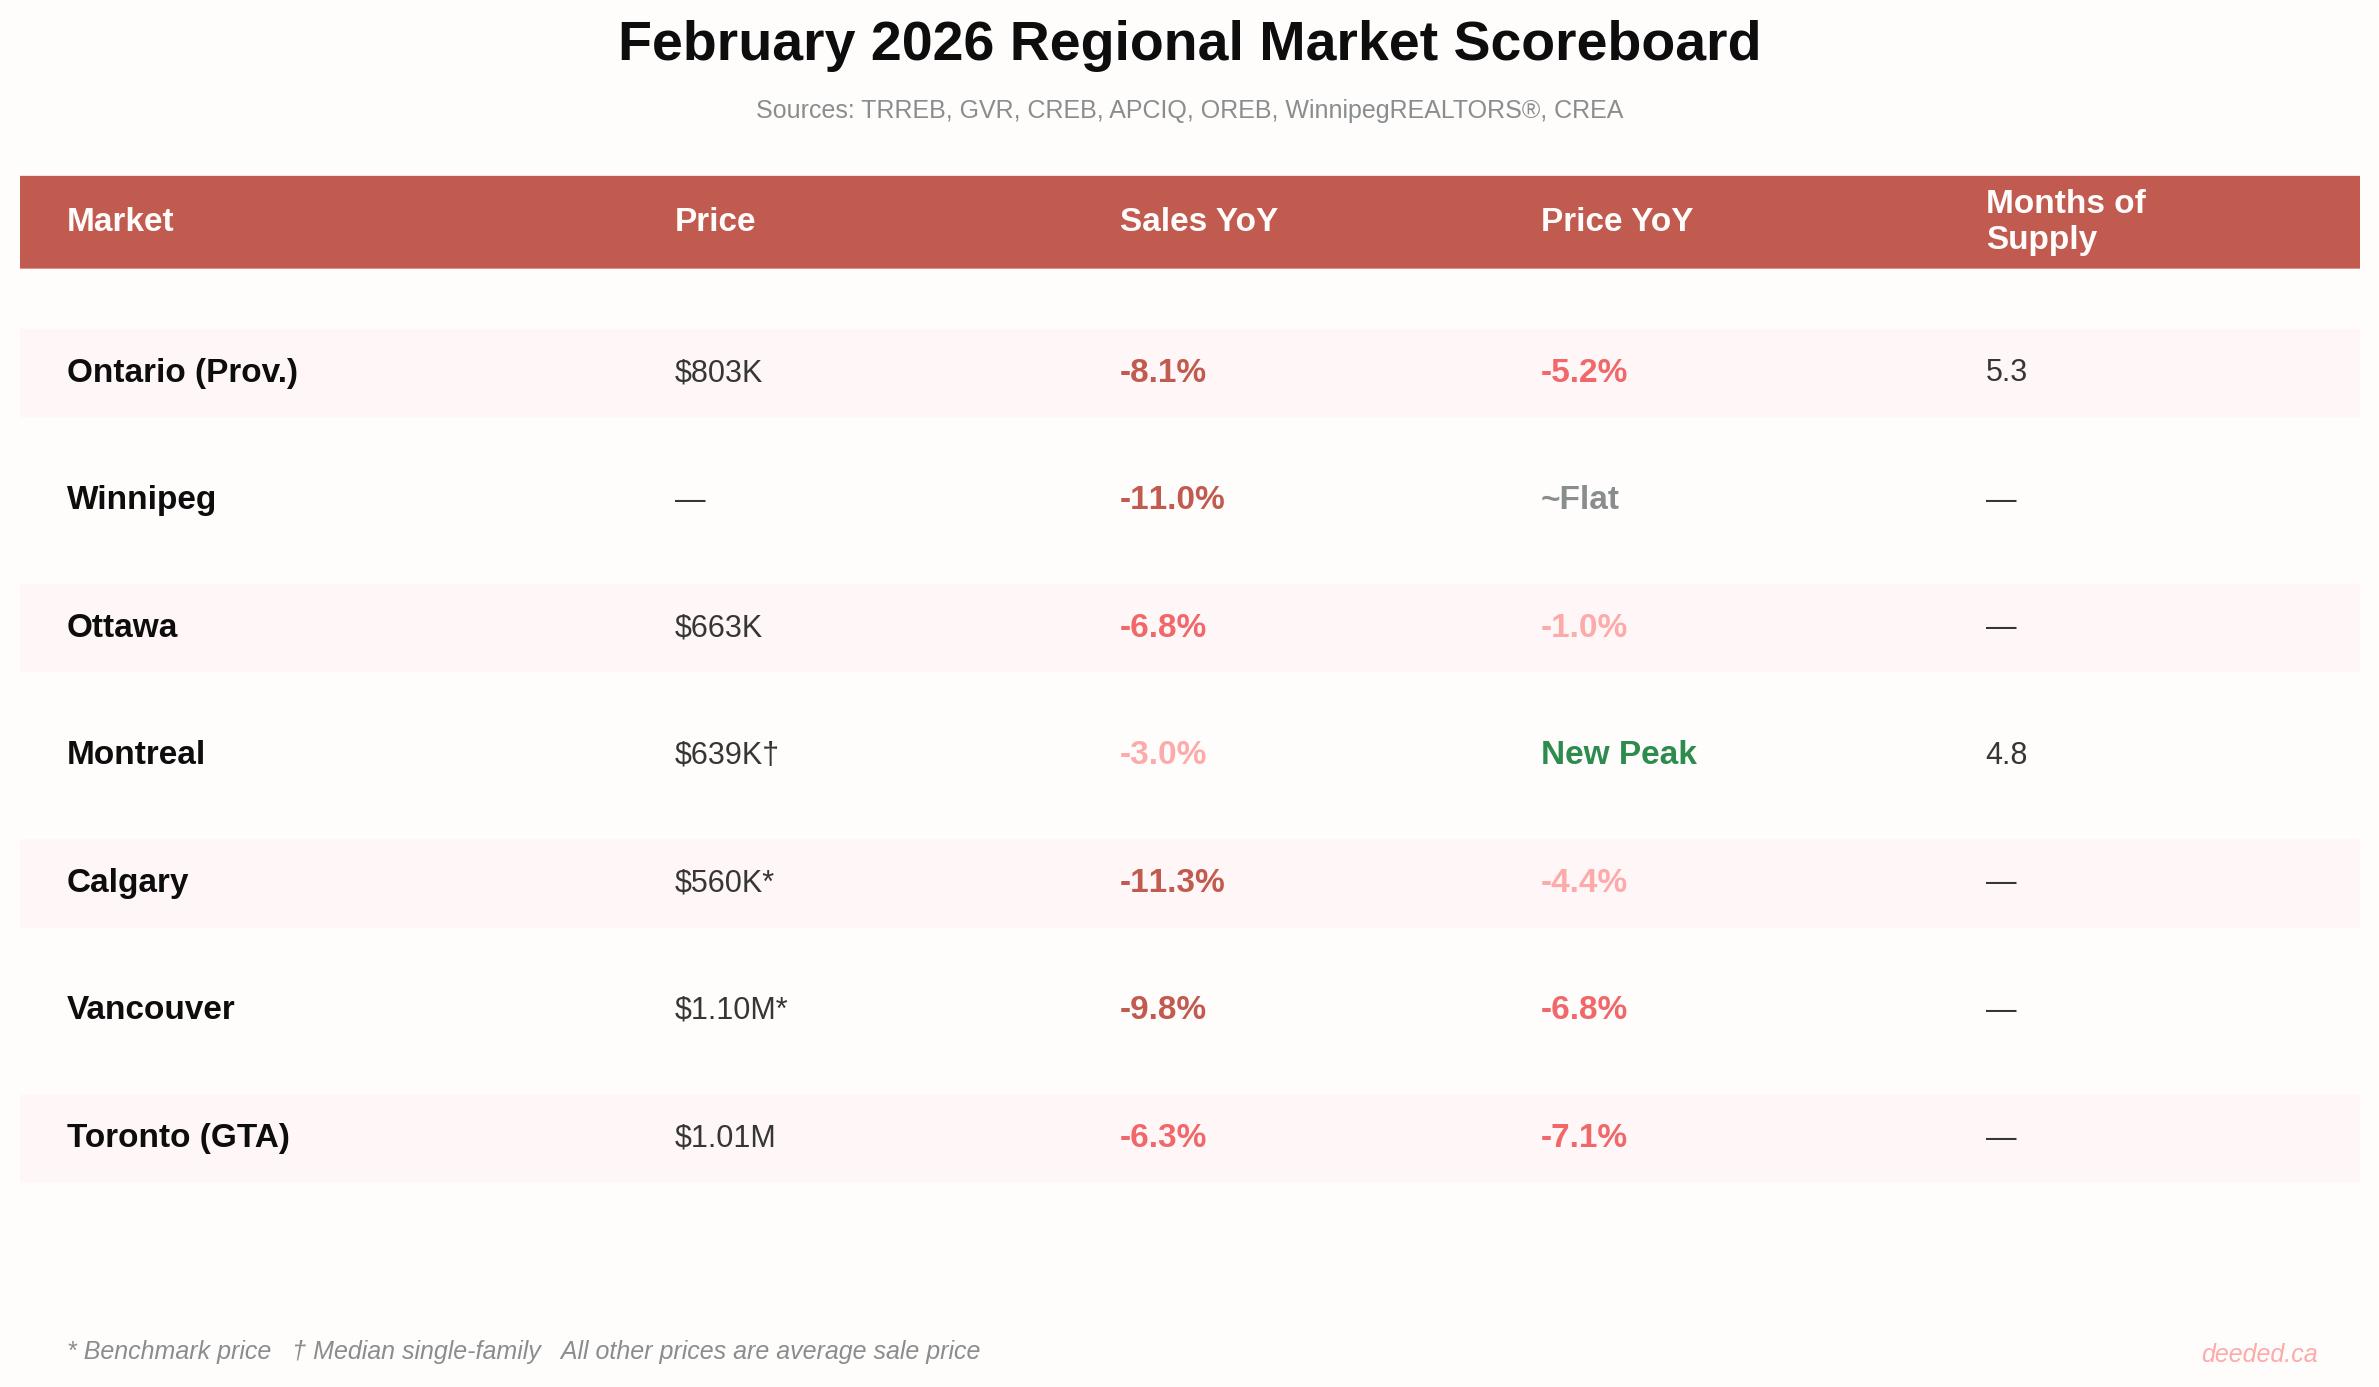
CREA's early Ontario data for February paints a sharper picture: 9,425 residential sales province-wide, down 8.1% year-over-year and a striking 35.5% below the 10-year average for February. The Ontario average price of $802,601 was down 5.2% from February 2025.
What's Driving the Slowdown?
Three forces are converging to keep buyers on the sidelines:
1. Tariff Uncertainty. The U.S.-Canada trade war is no longer a hypothetical. StatsCan reports that approximately 37% of Canadian businesses experienced a negative impact from U.S. tariffs in Q3 2025, with over 65% of manufacturing exporters noting direct hits. The Bank of Canada has called this "a new crisis," and GDP is projected to be 1.5% lower by year-end than pre-tariff forecasts. For housing, the confidence drag is real — buyers who feel uncertain about their employment or business prospects don't commit to the largest purchase of their lives.
2. Affordability Fatigue. Despite seven rate cuts since June 2024 bringing the Bank of Canada's overnight rate to 2.25%, incomes simply haven't kept up with home prices in Toronto, Vancouver, and other high-cost markets. The rate cuts helped at the margins, but they haven't solved the structural gap.
3. Immigration Slowdown. Canada's 2025–2027 Immigration Levels Plan cut permanent resident targets and set temporary resident goals designed to slow population-driven housing demand. The result: near-zero population growth in 2026, reducing the demand pressure that fuelled price gains in 2023–2024. CMHC estimates this will reduce the housing supply gap by approximately 534,000 units by 2030.
Greater Toronto Area: Still Searching for a Bottom
The GTA housing market continued its correction in February, with 3,868 sales reported through TRREB's MLS® System — down 6.3% year-over-year from February 2025. While that represented a solid 25.5% rebound from January's storm-depressed numbers, activity remained well below the levels most agents consider "normal."
Prices Under Pressure
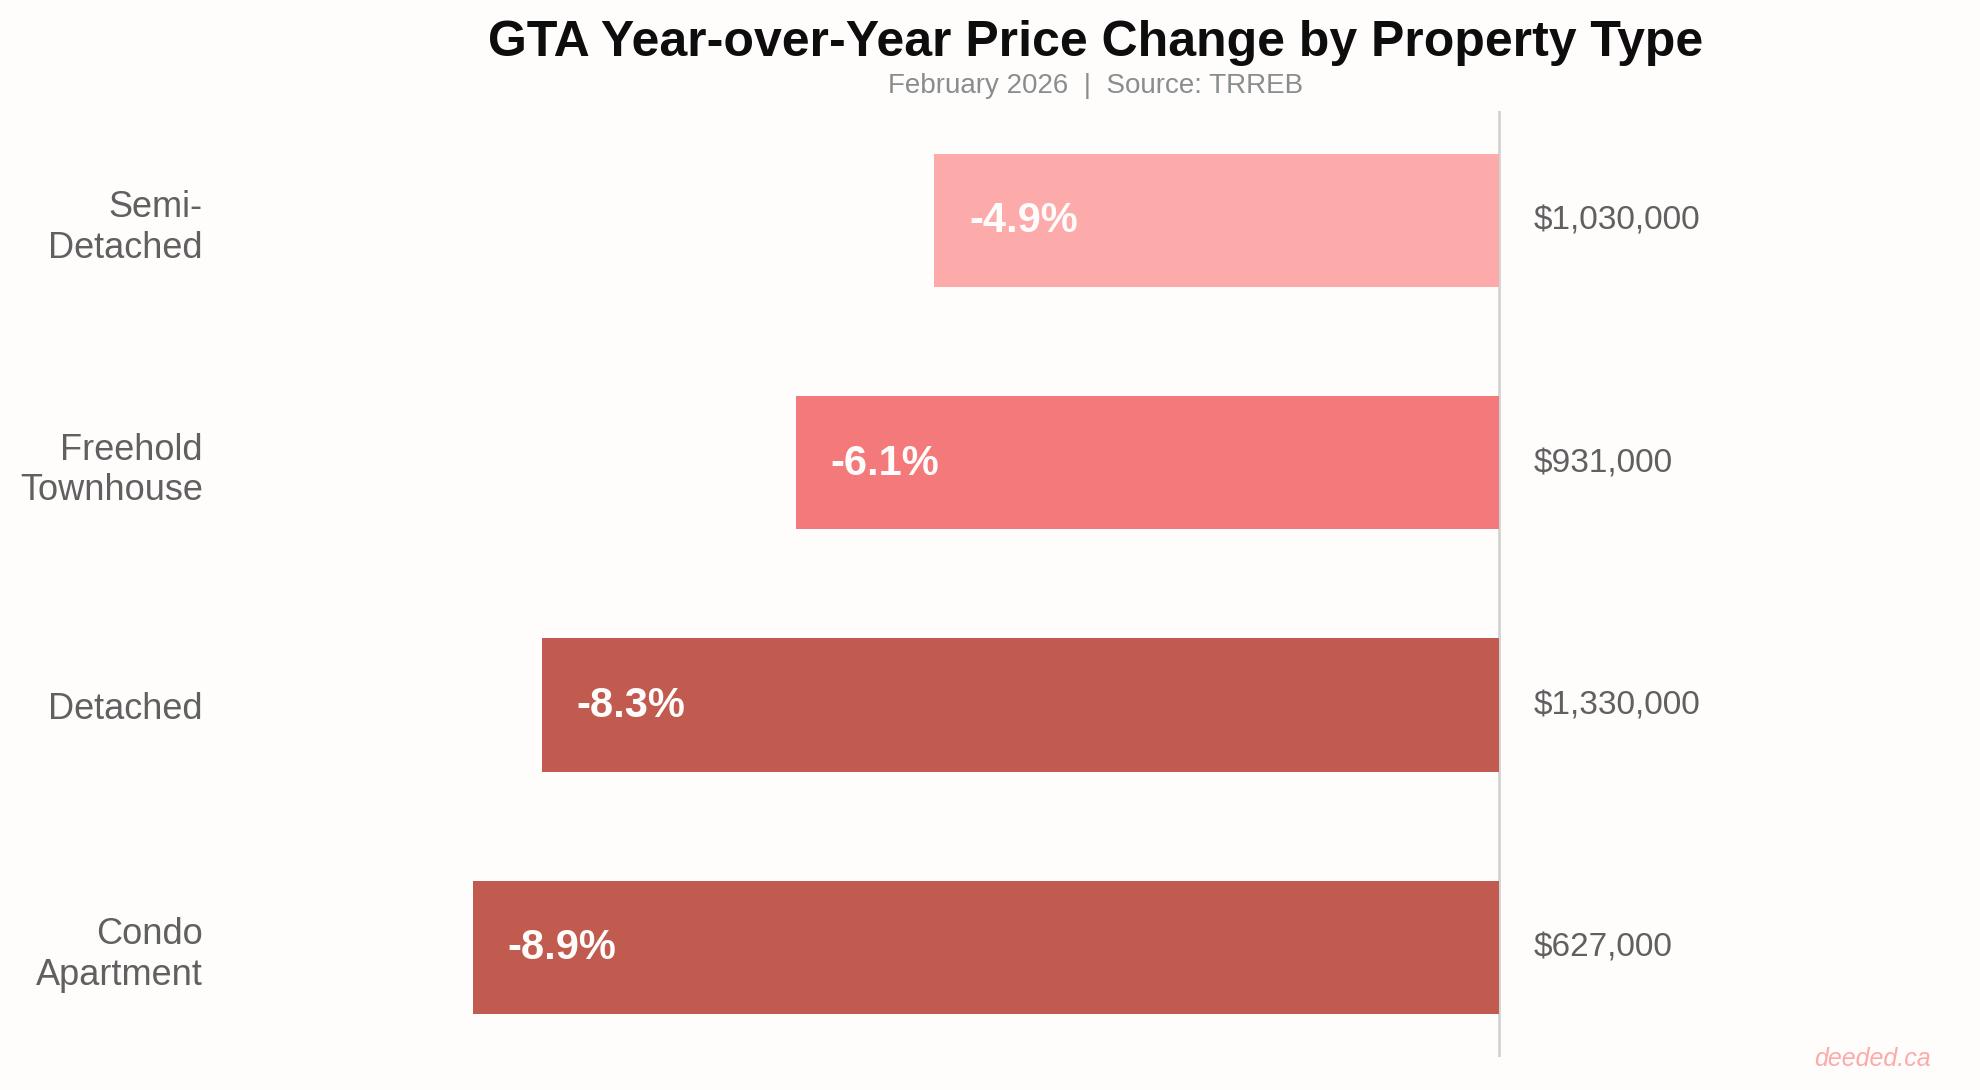
The headline number: the GTA average selling price fell to $1,008,968, down 7.1% year-over-year. The MLS® HPI Composite Benchmark dropped an even steeper 7.9% YoY to $938,800, though it posted a modest 0.3% monthly gain — a potential early signal of stabilization.
A Buyer's Market in Every Sense
For the first time this decade, the GTA's sale-price-to-list-price ratio dipped below 100% in February, settling at 97%. That means buyers are successfully negotiating 3% below asking on average, a dramatic shift from the bidding-war era. Average days on market climbed to 54 days, up from 43 days a year earlier.
New listings came in at 10,705, actually down 17.7% year-over-year, suggesting some sellers are pulling back, unwilling to list into a declining market. Active inventory stood at 19,414 listings, down 2.4% from a year ago.
TRREB notes that more than 100,000 buyers are estimated to be sitting on the sidelines, waiting for prices to level off and for positive trade news. Their re-entry could be the catalyst for the next phase — but timing remains uncertain.
"2026 has officially broken the floor established last year, marking the slowest start to a year in more than a decade." TRREB Market Watch
Greater Vancouver: The Correction Deepens
Vancouver's housing market offered little cheer in February, with 1,648 residential sales — down 9.8% from February 2025 and a significant 28.7% below the 10-year seasonal average.
Benchmark Prices Falling Across All Segments

The detached segment is now leading the decline at -8.8% YoY, while apartments and townhouses posted small monthly gains — a possible sign that the bottom-end of the market is finding a floor.
New listings were down approximately 7% year-over-year, driven primarily by fewer apartment listings entering the market. Greater Vancouver Realtors described the current conditions as the "new normal". A market adjusting to life with lower demand, higher inventory, and more price-conscious buyers.
Calgary: A Tale of Two Markets
Calgary's February data revealed a market splitting along property-type lines, with CREB® reporting 1,526 sales, down 11.3% year-over-year.
Detached Tightens, Condo UnitsFlood
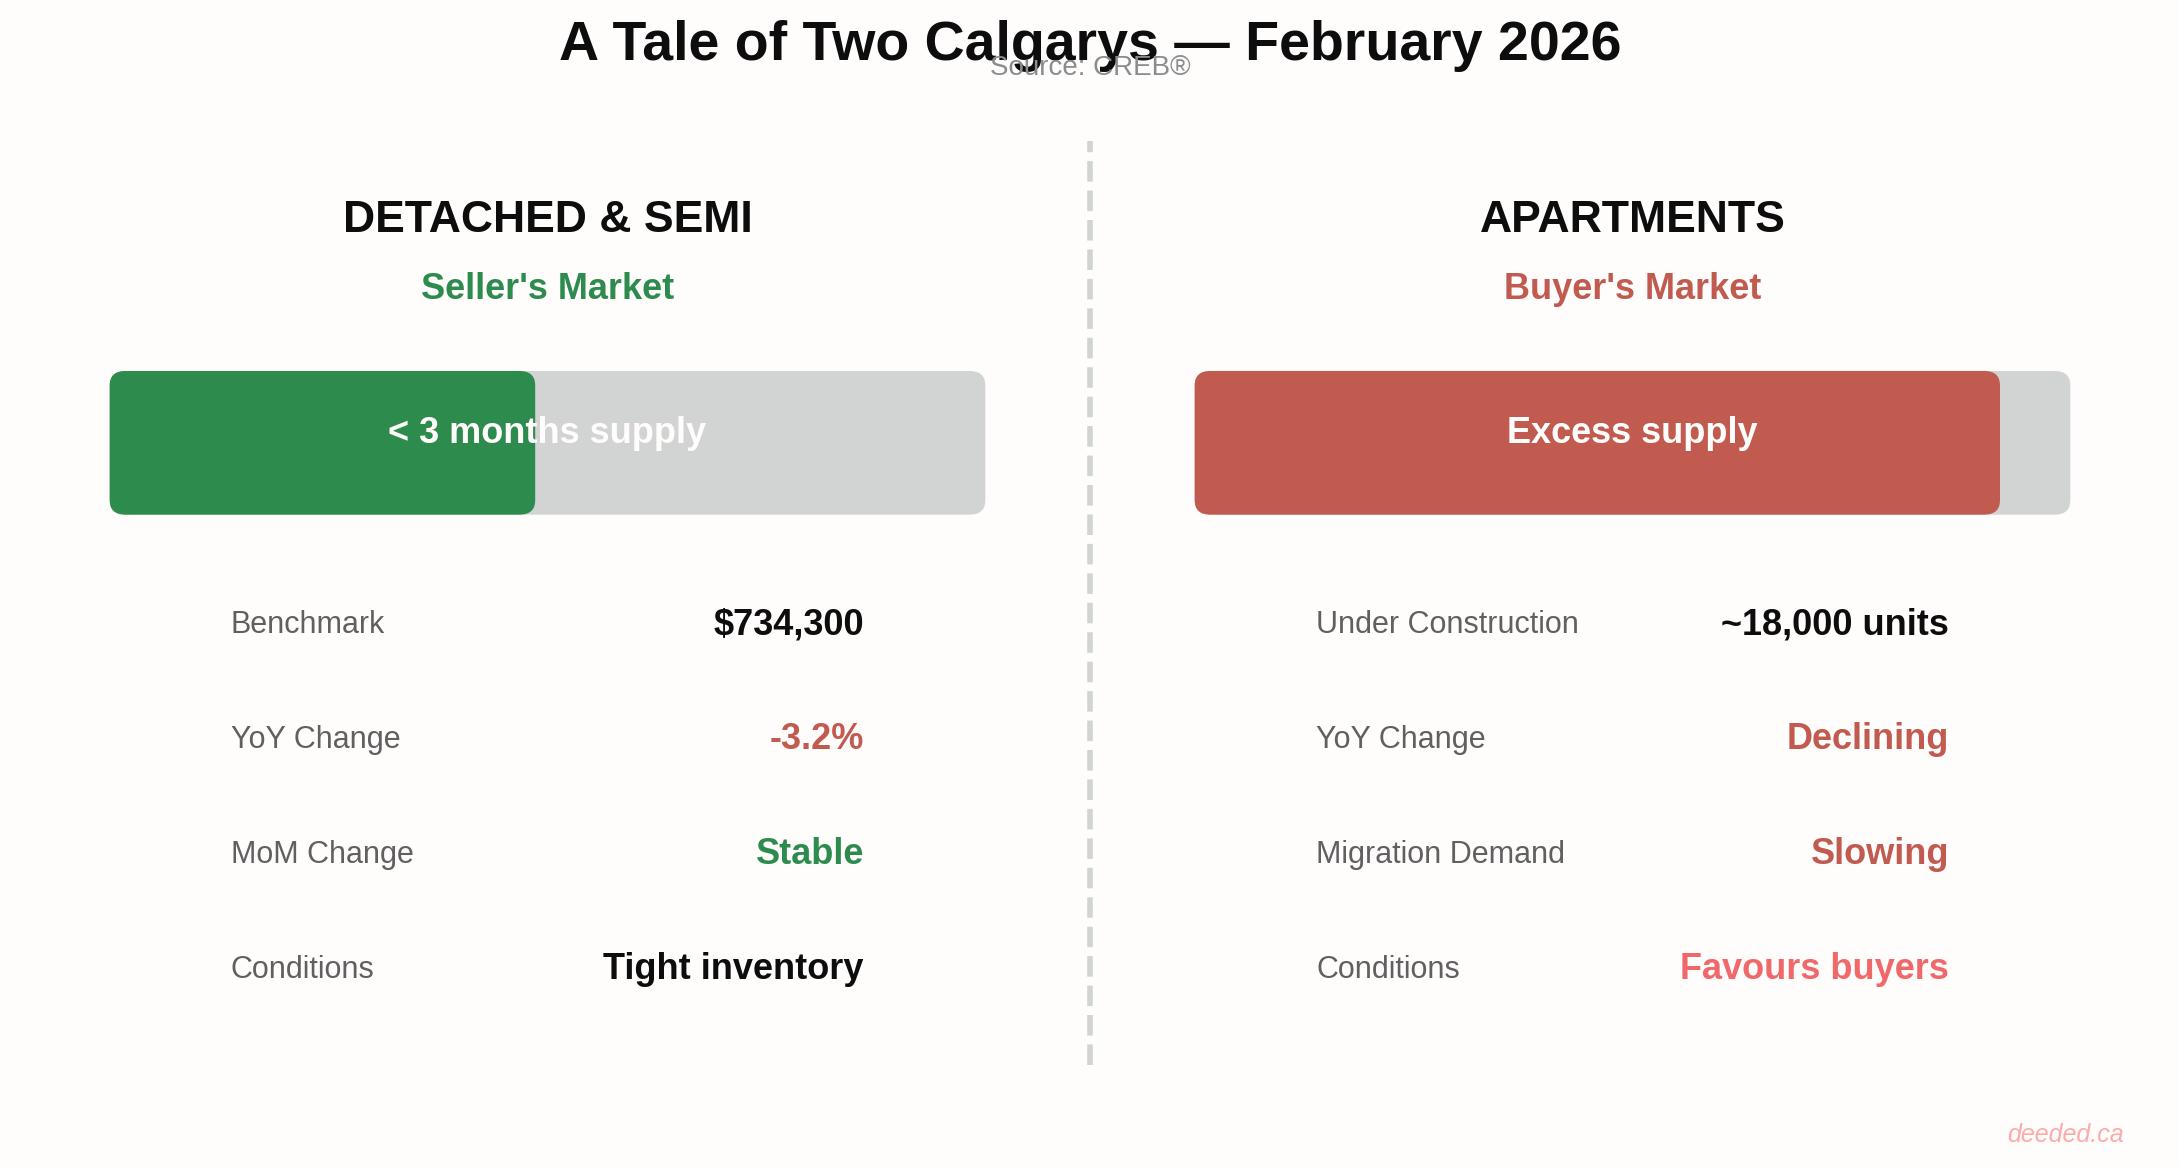
The most striking dynamic in Calgary is the bifurcation between property types. Detached and semi-detached homes remain relatively tight, with less than three months of supply, still firmly in seller's territory. The detached benchmark price of $734,300 is down 3.2% year-over-year but holding steady month-over-month.
Meanwhile, the Condo apartment segment is swimming in supply. With nearly 18,000 units currently under construction, largely driven by record-high apartment starts in 2025 and slowing migration levels reducing demand, conditions firmly favour buyers in this category.
The overall benchmark price of $560,500 was down 4.4% year-over-year but posted a 1.1% monthly gain, suggesting some short-term stability.
Inventory climbed to 4,822 listings, up 16.3% year-over-year, a significant build that bears watching heading into spring.
Montreal: The Stability Story
In contrast to the corrections playing out in Toronto, Vancouver, and Calgary, Montreal's market stabilized in February — and in some segments, continued to set records.
The Montreal CMA recorded 3,930 residential transactions, down a modest 3% year-over-year. More notably, activity levels were slightly above the historical average for February, making Montreal one of the few major Canadian markets performing at or above normal.
Price Highlights
The median price of a single-family home in Montreal reached a new peak of $639,000 in February 2026. The sales-to-new-listings ratio (SNLR) sat at 52%, placing the market squarely in balanced territory (40%–60%), with 4.8 months of inventory.
The one segment to watch: condominiums. Condo listings have surged well above their historical average on the Island of Montreal, and supply is approaching historical norms on the South Shore. This mirrors the national trend of condo oversupply driven by a combination of record construction starts and reduced immigration-fueled demand.
Plexes were the standout, posting the only year-over-year sales growth at +1% with 363 transactions — a niche opportunity for investors focused on income properties.
Other Markets Worth Watching
Ottawa
Ottawa recorded 780 residential sales in February, down 6.8% year-over-year. The average residential sale price of $662,773 was down a modest 1.0% YoY, while the median dropped more sharply at -3.1% to $615,450. A relatively restrained correction compared to Toronto.
Winnipeg
All MLS® sales of 786 in February were down 11% year-over-year, with total dollar volume falling 10% to just over $314 million. Detached prices were essentially flat year-over-year, while condominiums bucked the national trend with a 4% average price increase to $284,086 — the highest February average on record.
Quebec City
February activity in the Quebec City area signalled a highly competitive spring market ahead, with strong demand and tighter supply. The province of Quebec overall posted a +7.1% year-over-year benchmark gain — among the strongest in the country alongside Newfoundland (+9.7%) and Saskatchewan (+5.6%).
The Interest Rate Environment: Stable but Constrained
The Bank of Canada held its overnight rate at 2.25% heading into March 2026, and most major bank economists expect it to remain there through much of the year. The central bank's challenge is threading the needle: supporting an economy being dragged down by tariffs while managing inflation that, although improved, hasn't fully normalized.
For mortgage professionals, the key dynamic is renewals. A large wave of mortgages originated during the low-rate era are coming due in 2026, and many homeowners will face payment increases even at today's lower rates compared to their original 1.5%–2.5% pandemic-era contracts. This renewal pressure could drive some forced selling or, conversely, keep inventory tight as homeowners choose to hold rather than sell into a weak market.
Looking Ahead
CREA forecasts approximately 494,512 residential transactions nationally in 2026, a 5.1% increase over 2025, with the national average price forecast to rise 2.8% to $698,881 on an annual basis. The recovery, however, is expected to be back-half loaded — contingent on trade resolution, sustained low rates, and the gradual return of sidelined buyers.
The full national February 2026 CREA data will be released on March 17, 2026.
Unlock Your Seamless Closing Experience
Your Journey to a Worry-Free Closing Starts Here!